
Debugging is an important concept. The concept of debugging is trying to figure out what is wrong with your code or just trying to understand the code. There are many times where I will come to unfamiliar code and I will need to step through it in a debugger to grasp how it works. Most Python IDEs have good debuggers built into them. I personally like Wing IDE for instance. Others like PyCharm or PyDev. But what if you want to debug the code in your Jupyter Notebook? How does that work?
In this chapter we will look at a couple of different methods of debugging a Notebook. The first one is by using Python’s own pdb module.
Using pdb
The pdb module is Python’s debugger module. Just as C++ has gdb, Python has pdb.
Let’s start by opening up a new Notebook and adding a cell with the following code in it:
def bad_function(var):
    return var + 0

bad_function("Mike")
If you run this code, you should end up with some output that looks like this:
--------------------------------------------------------------------------- TypeError Traceback (most recent call last)in () 2 return var + 0 3 ----> 4 bad_function("Mike") in bad_function(var) 1 def bad_function(var): ----> 2 return var + 0 3 4 bad_function("Mike") TypeError: cannot concatenate 'str' and 'int' objects
What this means is that you cannot concatenate a string and an integer. This is a pretty common problem if you don’t know what types a function accepts. You will find that this is especially true when working with complex functions and classes, unless they happen to be using type hinting. One way to figure out what is going on is by adding a breakpoint using pdb’s set_trace() function:
def bad_function(var):
    import pdb
    pdb.set_trace()
    return var + 0

bad_function("Mike")
Now when you run the cell, you will get a prompt in the output which you can use to inspect the variables and basically run code live. If you happen to have Python 3.7, then you can simplify the example above by using the new breakpoint built-in, like this:
def bad_function(var):
    breakpoint()
    return var + 0

bad_function("Mike")
This code is functionally equivalent to the previous example but uses the new breakpoint function instead. When you run this code, it should act the same way as the code in the previous section did.
You can read more about how to use pdb here.
You can use any of pdb’s command right inside of your Jupyter Notebook. Here are some examples:
- w(here) – Print the stack trace
- d(own) – Move the current frame X number of levels down. Defaults to one.
- u(p) – Move the current frame X number of levels up. Defaults to one.
- b(reak) – With a *lineno* argument, set a break point at that line number in the current file / context
- s(tep) – Execute the current line and stop at the next possible line
- c(ontinue) – Continue execution
Note that these are single-letter commands: w, d, u and b are the commands. You can use these commands to interactively debug your code in your Notebook along with the other commands listed in the documentation listed above.
ipdb
IPython also has a debugger called ipdb. However it does not work with Jupyter Notebook directly. You would need to connect to the kernel using something like Jupyter console and run it from there to use it. If you would like to go that route, you can read more about using Jupyter console here.
However there is an IPython debugger that we can use called IPython.core.debugger.set_trace. Let’s create a cell with the following code:
from IPython.core.debugger import set_trace

def bad_function(var):
    set_trace()
    return var + 0

bad_function("Mike")
Now you can run this cell and get the ipdb debugger. Here is what the output looked like on my machine:
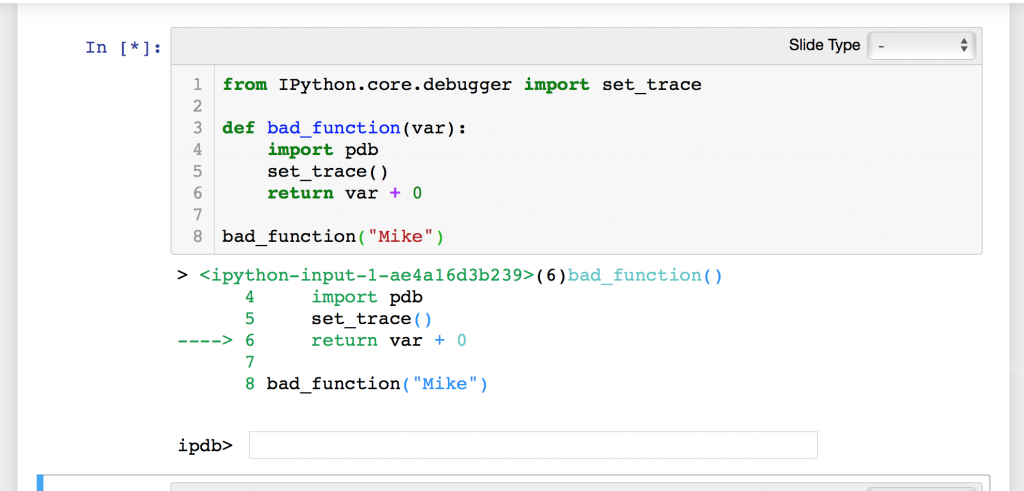
The IPython debugger uses the same commands as the Python debugger does. The main difference is that it provides syntax highlighting and was originally designed to work in the IPython console.
There is one other way to open up the ipdb debugger and that is by using the %pdb magic. Here is some sample code you can try in a Notebook cell:
%pdb

def bad_function(var):
    return var + 0

bad_function("Mike")
When you run this code, you should end up seeing the `TypeError` traceback and then the ipdb prompt will appear in the output, which you can then use as before.
What about %%debug?
There is yet another way that you can open up a debugger in your Notebook. You can use `%%debug` to debug the entire cell like this:
%%debug

def bad_function(var):
    return var + 0

bad_function("Mike")
This will start the debugging session immediately when you run the cell. What that means is that you would want to use some of the commands that pdb supports to step into the code and examine the function or variables as needed.
Note that you could also use `%debug` if you want to debug a single line.
Wrapping Up
In this chapter we learned of several different methods that you can use to debug the code in your Jupyter Notebook. I personally prefer to use Python’s pdb module, but you can use the IPython.core.debugger to get the same functionality and it could be better if you prefer to have syntax highlighting.
There is also a newer “visual debugger” package called the PixieDebugger from the pixiedust package:
I haven’t used it myself. Some reviewers say it is amazing and others have said it is pretty buggy. I will leave that one up to you to determine if it is something you want to add to your toolset.
As far as I am concerned, I think using pdb or IPython’s debugger work quite well and should work for you too.
Related Reading
- StackOverflow: What is the right way to debug in IPython Noteobook?
- The visual Python debugger for Jupyter Notebooks You’ve always wanted
- Debugging Jupyter Notebooks – David Hamann
Pingback: Getting Started with JupyterLab | The Mouse Vs. The Python
Pingback: Tips and Tricks for Jupyter Notebook for New Data Scientists | Keren Link