
I recently took on a project where I needed to graph some data on a webpage using data I had queried from a database. Since I love Python, I decided to use it to accomplish this task. I went with Flask for serving the webpage and pygal for creating the graphs. In this tutorial, I will show you how to do that too, but without the database logic. Instead, we’ll get weather data from the Weather Underground and graph that. Let’s get started!
Getting Started
To follow along with this tutorial, you will need to install Flask and pygal. Here’s how:
pip install Flask, pygal
If you don’t want to install Flask and all its dependencies onto your system Python, you should create a virtualenv, activate it and install these packages there.
Creating Simple Graphs in Flask
Creating graphs with pygal is a breeze. But before we can do that, we need some data! I decided to grab some data from the Weather Underground site. You will need to sign up with them to get an API key so you can query too. Once you have that, you can use the code below:
import pygal
import json
from urllib2 import urlopen # python 2 syntax
# from urllib.request import urlopen # python 3 syntax
from flask import Flask
from pygal.style import DarkSolarizedStyle
app = Flask(__name__)
#----------------------------------------------------------------------
@app.route('/')
def get_weather_data(date='20140415', state='IA', city='Ames'):
"""
Date must be in YYYYMMDD
"""
api_key = 'API_KEY'
url = 'http://api.wunderground.com/api/{key}/history_{date}/q/{state}/{city}.json'
new_url = url.format(key=api_key,
date=date,
state=state,
city=city)
result = urlopen(new_url)
js_string = result.read()
parsed = json.loads(js_string)
history = parsed['history']['observations']
imp_temps = [float(i['tempi']) for i in history]
times = ['%s:%s' % (i['utcdate']['hour'], i['utcdate']['min']) for i in history]
# create a bar chart
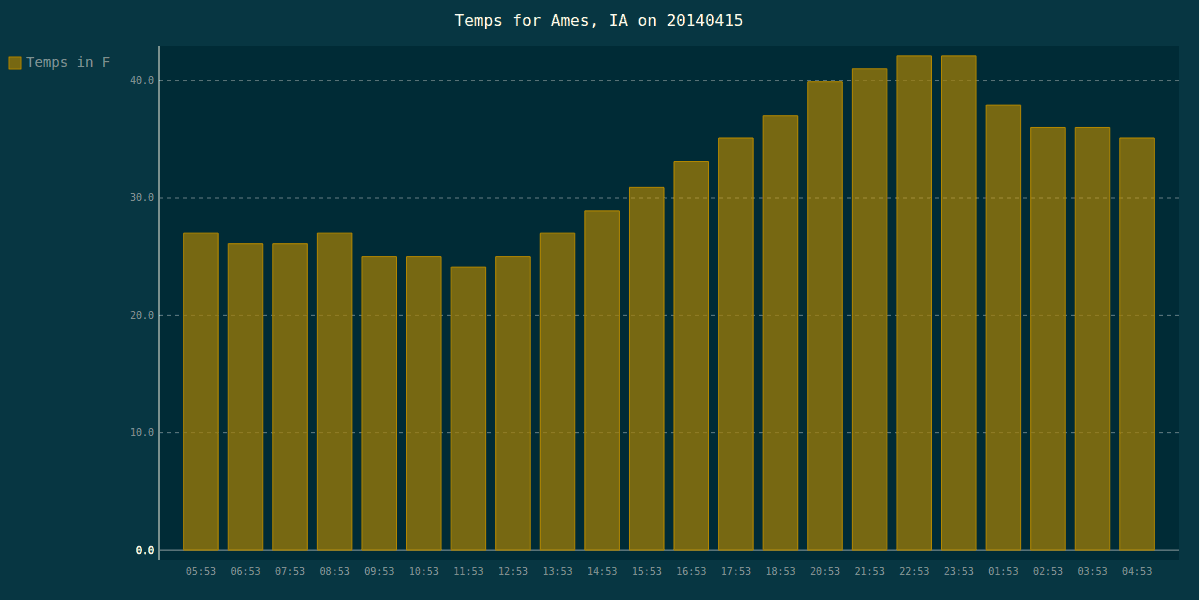
title = 'Temps for %s, %s on %s' % (city, state, date)
bar_chart = pygal.Bar(width=1200, height=600,
explicit_size=True, title=title, style=DarkSolarizedStyle)
#bar_chart = pygal.StackedLine(width=1200, height=600,
# explicit_size=True, title=title, fill=True)
bar_chart.x_labels = times
bar_chart.add('Temps in F', imp_temps)
html = """
%s
%s
""" % (title, bar_chart.render())
return html
#----------------------------------------------------------------------
if __name__ == '__main__':
app.run()
Let’s break this down a bit. The main part we want to look at is the get_weather_data function. It has a decorator @app.route(‘/’) that tells Flask to call this function if we go to the home page of the website. The home page in this case would be http://localhost:5000/. Next we have our Weather Underground API key and the URL we want to use. In this case, I am grabbing historical data. You can use a slightly different URL to query for current weather. After that, we open our URL, read it and parse the JSON it returns. Finally we pull out the temperatures in Imperial format along with the hours of the day that they were recorded.
Now that we have our data, we can create our graph! We’ll start by creating a bar chart. Here I set the size of the bar chart as otherwise it will end up being quite large. Then we set its X labels and add the data to the chart. Finally we create the HTML to display and call Pygal’s render method, which returns an SVG in XML. You can call other rendering methods that will return other types too.
If you want to try out one of the many other charts that Pygal provides, comment out the call lines that instantiate the bar chart and uncomment out the lines for the StackedLine graph. Then re-run the script. You should end up with a graph that looks like this:

Using a Template to Display the Graph
Most of the time, you’ll want to use a template when you’re using Flask. The templates that Flask are created using Jinja. You will need to create a templates folder in the same directory where you saved the Python code above. In it, you will need to put the following HTML code:
        {{ title }}


            {{ bar_chart.render()|safe }}
You will note that we need to tell Jinja that rendered SVG XML is safe. Otherwise it will try to escape the XML and you’ll end up with some really weird looking output. We also need to change our Python code to render the template. Let’s do that now:
import pygal
import json
from urllib2 import urlopen  # python 2 syntax
# from urllib.request import urlopen # python 3 syntax

from flask import Flask, render_template
from pygal.style import DarkSolarizedStyle

app = Flask(__name__)

#----------------------------------------------------------------------
@app.route('/')
def get_weather_data(date='20140415', state='IA', city='Ames'):
    """
    Date must be in YYYYMMDD
    """
    api_key = 'API_KEY'
    url = 'http://api.wunderground.com/api/{key}/history_{date}/q/{state}/{city}.json'
    new_url = url.format(key=api_key,
                         date=date,
                         state=state,
                         city=city)
    result = urlopen(new_url)
    js_string = result.read()
    parsed = json.loads(js_string)
    history = parsed['history']['observations']

    imp_temps = [float(i['tempi']) for i in history]
    times = ['%s:%s' % (i['utcdate']['hour'], i['utcdate']['min']) for i in history]

    # create a bar chart
    title = 'Temps for %s, %s on %s' % (city, state, date)
    bar_chart = pygal.Bar(width=1200, height=600,
                          explicit_size=True, title=title,
                          style=DarkSolarizedStyle,
                          disable_xml_declaration=True)
    bar_chart.x_labels = times
    bar_chart.add('Temps in F', imp_temps)

    return render_template('index.html',
                           title=title,
                           bar_chart=bar_chart)


#----------------------------------------------------------------------
if __name__ == '__main__':
    app.run()
You will note that we imported the render_template function and that we use that to load the template. We also need to tell PyGal to disable xml declaration. If we don’t, then we’ll get some unicode decoding errors. Anyway, give this code a try and you should have the same graph as before.
Wrapping Up
At this point, you should be able to create your own graphs using Flask and Pygal. I recommend checking out Pygal’s documentation so you can see the many other types of graphs it can do. It also has a lot of fun styles that you can apply to your graphs. You will also want to check out Flask’s documentation to learn how to add CSS and other niceties. Have fun!
Further Reading
- The Flask mega tutorial
- Flask documentation
- Pygal website
- Jinja documentation
Does the import urllib2 work in python3?
No. You will need to use urllib.request instead. I updated the code examples slightly to reflect that.
Great topic for your blog.
I enjoyed reading, now to test it in action. Thanks.
I tried that first and it didn’t return a graph. It returned something like this instead: “”. Not very helpful.
Pingback: Graphing packet details with PyShark, pygal, and Flask | thePacketGeek
Pingback: Everything there is to know about Python Flask – Jonathan Morales Blog